Weather Data
Punta Cana Temperature by Month
Updated: 2026-06-01
Executive summary
Punta Cana's monthly mean ranges from 25.4 °C in January to 29.3 °C in August — a 4 °C annual swing. Every month delivers 28–31 °C day highs and warm nights (22–26 °C).
Key statistics
29.3 °C
Warmest month (Aug)
25.4 °C
Coolest month (Jan)
4 °C
Annual swing
22 °C
Lowest night
Month-by-month temperatures
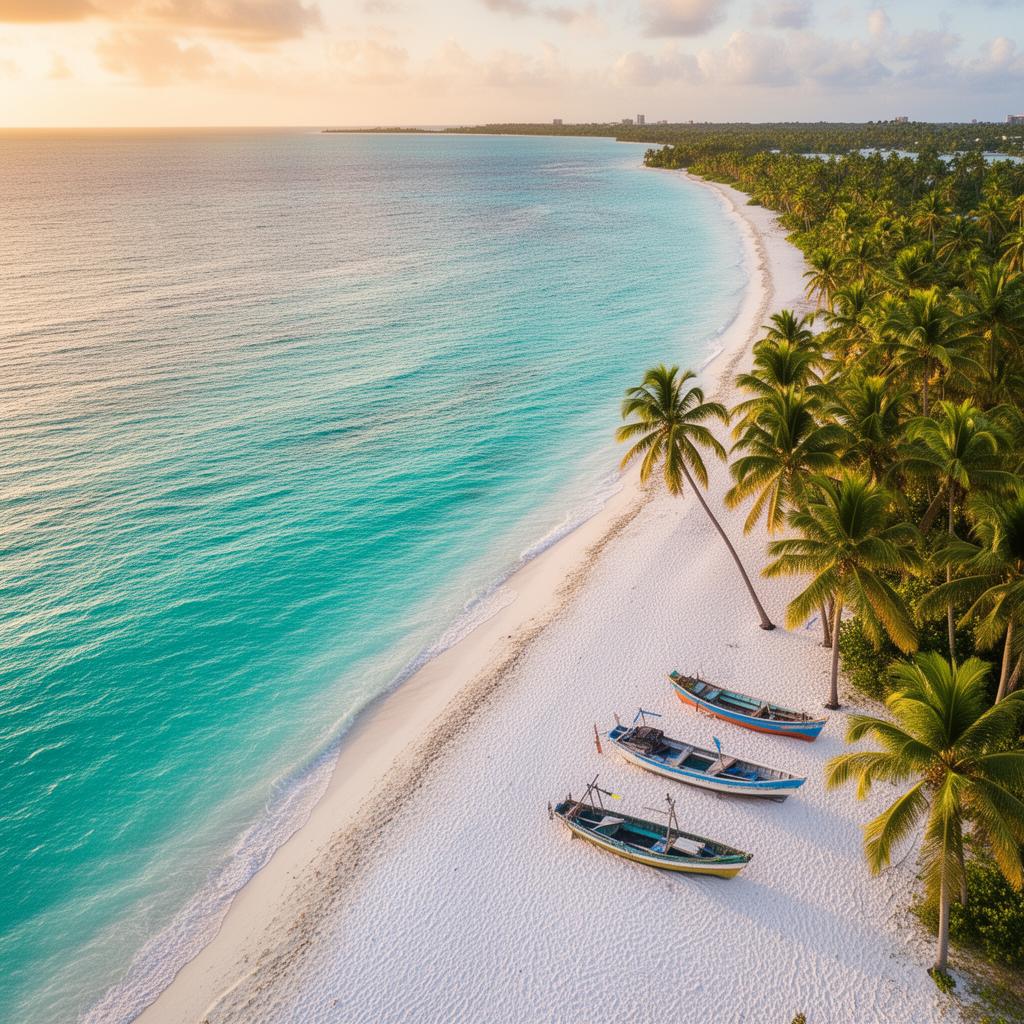
Punta Cana's annual temperature swing is tiny — only 4 °C between the warmest and coolest month. Day highs sit at 28–31 °C every single month; nights rarely dip below 22 °C. The most comfortable window for active touring is December through April (lower humidity, breezy).
Punta Cana — average temperature by month (°C)
| Month | Avg temp | Day / Night °C |
|---|---|---|
| January | 25.4 °C | 28 / 22 |
| February | 25.4 °C | 28 / 22 |
| March | 25.8 °C | 29 / 23 |
| April | 26.4 °C | 29 / 23 |
| May | 27.4 °C | 30 / 24 |
| June | 28.4 °C | 31 / 25 |
| July | 28.6 °C | 31 / 26 |
| August | 29.3 °C | 31 / 26 |
| September | 29.0 °C | 31 / 26 |
| October | 28.4 °C | 30 / 25 |
| November | 27.4 °C | 30 / 24 |
| December | 26.2 °C | 29 / 23 |
Source: Weather Atlas, Climate-Data.org, ONAMET (1991–2020).
FAQ
Frequently asked questions
Is it ever cold in Punta Cana?+
Hottest months?+
Sources & methodology
- Weather Atlas — Punta Cana climate (monthly averages) — 30-year normals for temperature, rainfall, humidity, UV, sea temp
- Climate-Data.org — Punta Cana climate normals — Köppen Aw — tropical savanna
- ONAMET — Oficina Nacional de Meteorología (DR) — Official Dominican meteorological service
More research from the Data Center
Featured
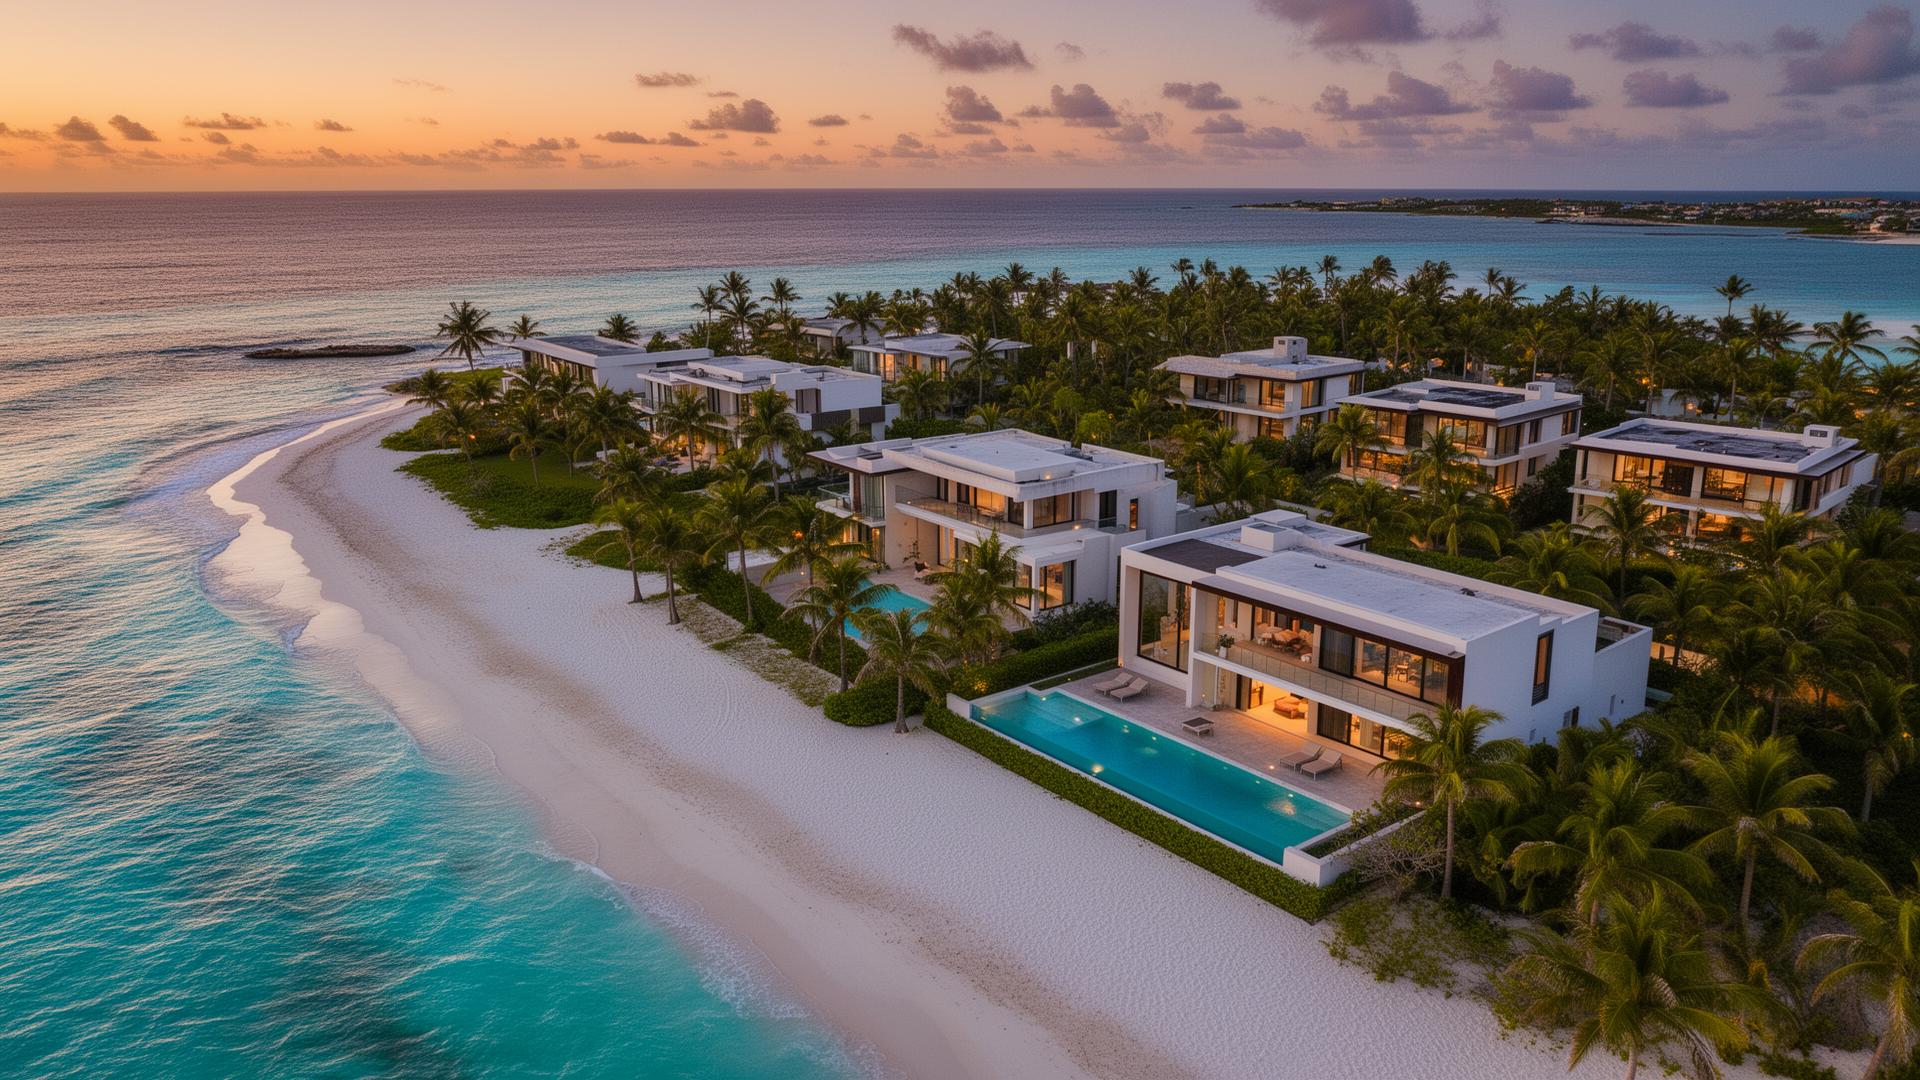
Punta Cana Excursions
Turn what you just read into a real day on the water. These six experiences are the ones we book most for first-time visitors.
Saona Island Premium 4 Beaches Tour
Premium speedboat tour to 4 of Saona's most beautiful beaches — all inclusive.
✓ Reserve now, pay on tour day
Catalina Island Tour
Snorkel the famous wall reef and unwind on a white-sand beach — All Inclusive with open bar & Dominican buffet.
✓ Reserve now, pay on tour day
Party Boat & Snorkeling
3 hours all-inclusive: all-you-can-drink open bar, snorkeling, dolphins and the legendary sandbar pool party.
✓ Reserve now, pay on tour day
Macao Buggy & Cenote Adventure
Off-road buggy ride, private cenote swim & Dominican tastings in the Macao countryside.
✓ Reserve now, pay on tour day
Horseback Beach Riding
Trot along untouched Caribbean shoreline at golden hour.
✓ Reserve now, pay on tour day
Private Yachts
Half-day, full-day or sunset charters with captain and crew.
Price on request tailored quote
Book on WhatsApp